SITE -Status, Slideshow, Footprint
ANALYZER
- Equipment Log
- PowerWatch™
- Communication
- Carbon Footprint
- Best Days
- Payback Calculator
Data Logging
Reports
WebFilm® CMS
Cloud Computing
WeatherTrak™
PayCheck™
SnoCam™
LobbyVu™
WebLab™ - Schools
LDC SCADA control
SMART Enterprise
SurePoint™
| Live Sites |
| Industrial 60kW 135kW 250kW |
| Commercial 200kW 200kW 225kW |
| Factory 250kW 500kW 500kW |
| Municipal 10kW 30kW 100kW 240kW |
| Farm 10kW 100kW 250kW |
| Rural 10kW 70kW 100kW 470kW |
| Utility 4kW 7.8kW 100kW |
| Tracker 10kW 50kW 140kW 500kW |
| Education 10kW 10kW 74kW 75kW |
| Schoolboard Big Green Board |
| Retail 2.4kW 7kW 10kW 150kW |
| Residential 5kW 6kW 10kW 250kW |
| Net Metered 10kW |
| Solar Thermal 2kW 4kW 75kW |

Return on Investment
With only a few saved parameters like installed cost per watt, startup date and solar map projections for this location SolarVu® will continuously update the financial returns from measured output. Although the financial model does not use sophisticated rate of return calculations, it does provide a simple estimate of payback. On the Payback screen, useful system performance metrics like yield, cost/watt generated and breakeven date are shown. Switch to the Revenue screen for projected revenues and lifetime income at the current rate of energy generation.
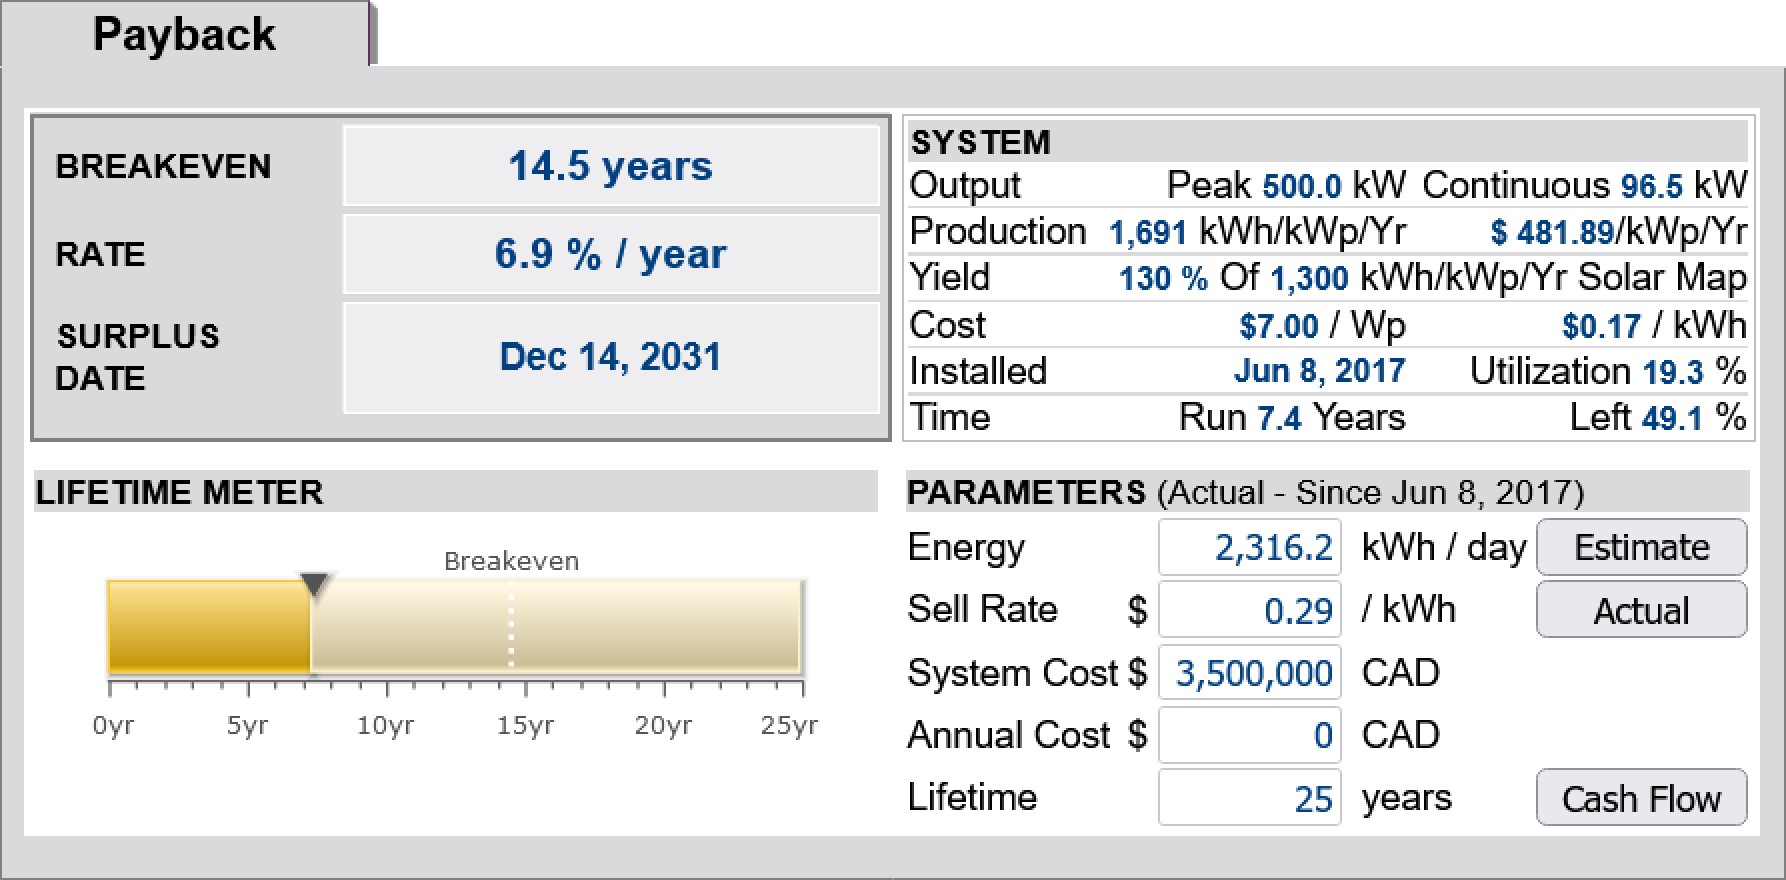
Payback Calculator
Breakeven date?
Actual /expected yield?
Cost/watt generated?
Actual output per watt?

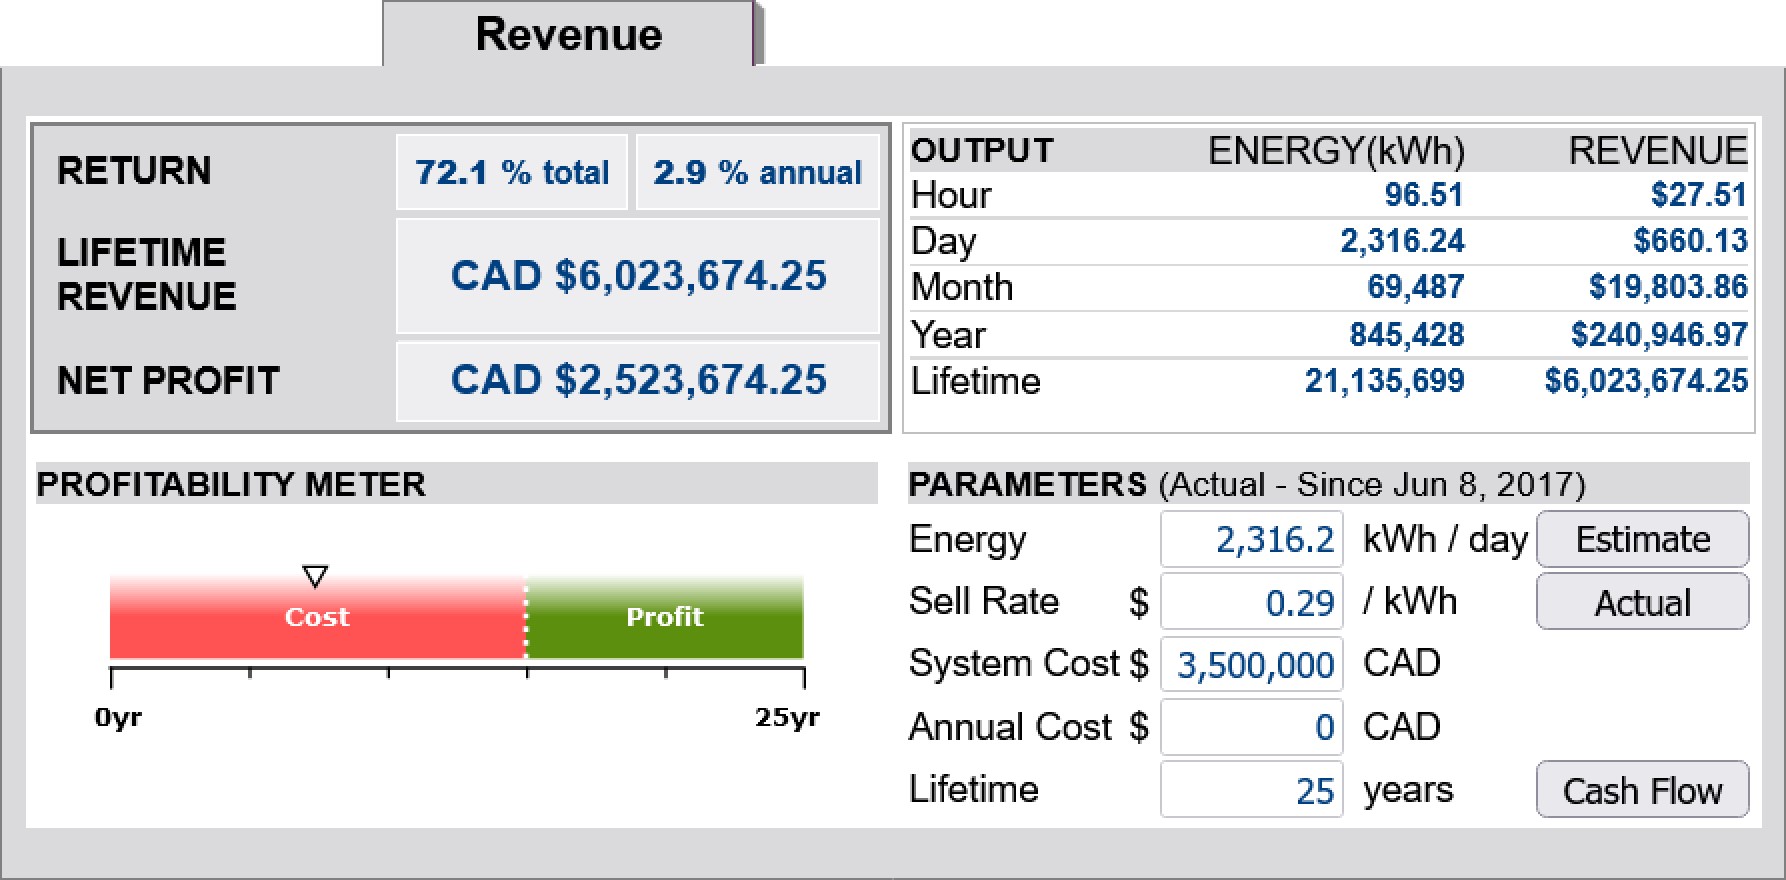
Revenue Calculator
Rate of return?
Lifetime revenue?
Average revenue?
Profit?
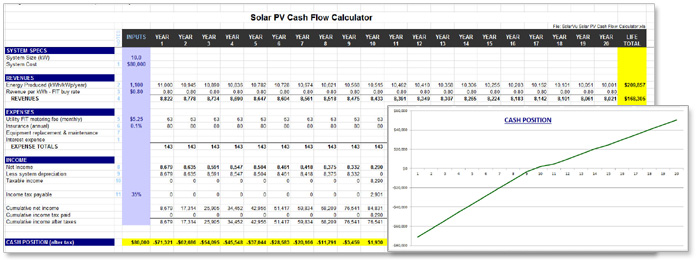
Cash Flow Projections
A spreadsheet template can be downloaded for manually calculating cash flow. Save time creating a model from scratch by using this as a starting point. Modify for different assumptions and change formulas to suit unique situations. Graphs and tables using tools built into the spreadsheet program can be saved and printed for reports.